QUEST Center for Responsible Research at Berlin Institute of Health was established in 2017 to strengthen research QUality and Ethics, Open Science, and Transparency across the entire lifecycle of biomedical research studies, from study design to research conduct, reporting, and the dissemination of research findings.
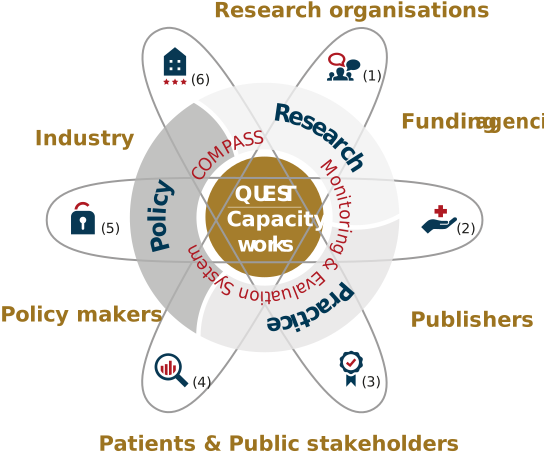
The Center’s intervention portfolio comprises six thematic programme areas, represented by the icons in the accompanying figure: Patient and Stakeholder Engagement (1), Research Ethics (2), Rigorous Research Methodology (3), Evidence Synthesis (4), Research Data Management and Sharing (5), and Research Assessment (6).
Within its Research–Practice–Policy framework, QUEST Center generates empirical evidence to identify systemic weaknesses and inefficiencies in the production of scientific knowledge in biomedicine (and beyond). These findings inform the co-creative development, implementation, and contextual adaptation of practical solutions in collaboration with researchers, clinicians, and other stakeholders across the research system. The resulting evidence and practice-based insights gained from the Center's activities and implementation studies aim to support decision-making at institutional, national, and international levels.
The Center's Monitoring and Evaluation System COMPASS complements this work by combining continuous performance monitoring with targeted evaluations to assess the scope and diversity of project outputs and effects, thus strengthening the Center's accountability and organisational learning.
QUEST Teams
Research groups
Teams & Units
Team Open Data and Research Data Management
Team Patient & Stakeholder Engagement (PSE)
Team Responsible Health Data Analysis
Team Meta-Research and Automated Screening
Monitoring & Evaluation Unit
Responsible PrecliniX Unit
Administration & Project Management, IT & Data Science
Overview
BIH QUEST Center has established a multi-level intervention programme comprising interconnected programme areas. Through this programme, the Center designs and implements measures to advance quality-centred research practices and governance in the biomedical sciences at Charité – Universitätsmedizin Berlin and beyond. Please note: Each chart can be downloaded as an image using the camera icon in the chart toolbar; this function is not available for the geomap. To view absolute figures, hover over the relevant chart element.
Project landscape
Distribution of Project Parties
The map shows the geographic distribution of project parties and collaboration partners, illustrating the Center’s local, national and international reach across diverse regions and scientific communities.
To view detailed information about an individual project and its cooperation partners, select the project from the project list. Markers at nearby or identical locations are grouped into clusters; select a cluster to expand it.
Programme Areas and Partner Organisations
This graph links QUEST programme areas to organisations classified as cooperation partners or external project entities.
Node size and connection width represent the number of distinct projects. Hover over a connection to view the associated project acronyms. (For further detail, please see the Project tab of this dashboard.)
Please note: By default, the cross-area overview includes only organisations connected to multiple programme areas. Selecting a specific area displays all partner organisations documented for that area.
Project outputs
Project Outputs
The graph shows the distribution of project outputs generated by the intervention programme across six output dimensions: Performance measure, Intervention, Support measure, Resource, Policy publication, and Research. These dimensions are further disaggregated into thematic sub-dimensions and specific output formats.
The width of each Sankey stream indicates the relative frequency of outputs. The numbers in parentheses show how many projects produced outputs within the corresponding category.
Project characteristics
Funding Type
The graph shows the distribution of funding types supporting the projects of QUEST Center’s intervention programme.
Each segment represents a funding category, with its size indicating the category’s percentage share among projects for which funding information is available.
Business Sector
The graph shows the distribution of business sectors addressed by the projects of QUEST Center’s intervention programme, highlighting the diverse target groups the Center engages with.
Each segment represents a specific business sector, with its size indicating the sector’s percentage share across all projects.
Project Mode
The graph shows the modes of cooperation through which the projects of QUEST Center’s intervention programme are conducted, distinguishing between individual and collaborative projects.
Each bar represents a mode of cooperation, with its length indicating the total number of projects within the corresponding category.
Project Role
The graph shows the roles assumed by QUEST members in its collaborative projects.
Each bar represents a specific project role, with its length indicating the number of projects in which the Center performs that role.
"Pitching QUEST" Initiative
Activity trends
Pitching QUEST Activities — Aggregate
Through Pitching QUEST, the Center presents its services within the context of relevant themes and topics to Charité leadership.
Each bar represents a selected theme or topic, with its length corresponding to the number of pitches offered.
Pitching QUEST Activities — Occurrences over Time
Each dot marks a distinct activity occurrence on its recorded date. Repeated participant records for the same activity instance and date count once; larger dots indicate several distinct occurrences on the same date.
Organisational reach
Distribution of Participants (Charité)
The graph shows the distribution of Charité leadership who took advantage of the opportunity to receive a tailored QUEST pitch for their institute, department, or working group.
Each bar represents an organisational unit within Charité, with its height corresponding to the number of pitches delivered.
Show Legend
- 1 Center for Health and Human Sciences
- 2 Center for Basic Sciences
- 3 Center for Oral Health Sciences
- 4 Center for Biomedicine (incl. Core Facilities, Charité 3ᴿ, Research Center and Excellence Cluster)
- 5 Center for Diagnostic Laboratory and Preventive Medicine
- 6 Center for Diagnostic and Interventional Radiology and Nuclear Medicine
- 7 Center for Anesthesiology and Intensive Care Medicine
- 8 Center for Surgery
- 9 Center for Orthopedics and Traumatology
- 10 Center for Multidisciplinary Medicine
- 11 Center for Global Health
- 12 Center for Internal Medicine and Dermatology
- 13 Center for Internal Medicine with Gastroenterology and Nephrology
- 14 Center for Tumor Medicine
- 15 Center for Neurology, Neurosurgery and Psychiatry
- 16 Center for Audiology/Phoniatrics, Ophthalmology and Otorhinolaryngology
- 17 Center for Gynecology, Perinatal, Pediatric and Adolescent Medicine
- BIH Berlin Institute of Health
- DHZC Deutsches Herzzentrum der Charité
- Students Students who are not affiliated with one of the organisational units mentioned
- Administration Charité Business Divisions or Administrative Offices
- Other This category refers to participants who are affiliated with spin-offs or holdings of the Charité, BIH´s privileged partner organisation Max Delbrück Center for Molecular Medicine or other (research) organizations.
Distribution of Participants (BIH)
The graph shows the distribution of BIH leadership who took advantage of the opportunity to receive a tailored QUEST pitch for their institute, department, or working group.
Each bar represents a BIH organisational unit, with its height corresponding to the number of pitches delivered.
Show Legend
- CMA— Central Management and Administration
- TSA — Translational Sciences and Applications (TSA)
- QUEST — Center for Responsible Research (QUEST) - Not Applicable
- CSC — Clinical Study Center
- Core Units — Core Facilities
- EDS — Exploratory Diagnostic Sciences (EDS)
- Vascular Biomedicine — Center of Vascular Biomedicine
- Immunomics — Center of Immunomics
- Genomics — Center of Genomic Medicine
- APT — Advanced and Personalized Therapies (APT)
- Julius Wolff — Musculoskeletal Biomechanics and Regeneration
- BCRT — Center for Regenerative Therapies (BCRT)
- MHDS — Medical Health Data Sciences (MHDS)
- Digital Health — Center Digital Health
- Health Data Sc. — Center Health Data Sciences
- CPD — Competence and Project Development
- BIA — Biomedical Innovation Academy (BIA)
- CBI — Charité BIH Innovation (CBI)
- Clinical Incubator — Clinical Incubator
- Not Specified — BIH members, Section or Center not specified
Participant profile
Status Group
The graph shows the proportion of participants reached by academic status group.
Each segment represents a status category, with its size indicating the percentage share.
Gender of Participants
The graph shows the gender distribution of participants, categorised as female, male, or diverse (non-binary).
Each segment represents the proportion of the target group within that category.
"WMMit" Initiative
Activity trends
"Wir machen mit" Initiative — Aggregate
As part of the “Responsible Research” strategic pillar, BIH QUEST Center coordinates the “Wir machen mit” (we are on board) initiative, which offers Charité leadership a variety of opportunities to actively contribute to the “Charité 2030 – Rethinking Health” organisational strategy.
Each bar represents a “Responsible Research” topic or “Wir machen mit” opportunity, respectively, in which Charité leadership was engaged, with its length corresponding to the number of contributions.
"Wir machen mit" Initiative — Occurrences over Time
Each dot marks a distinct activity occurrence on its recorded date. Repeated participant records for the same activity instance and date count once; larger dots indicate several distinct occurrences on the same date.
Organisational reach
Distribution of Participants (Charité)
The graph shows the distribution of WMMit participations across different organisational units, illustrating the interest of Charité leadership in WMMit measures offered by BIH QUEST Center and its partners.
Each bar represents a Charité unit, with its height corresponding to the number of WMMit contributions booked.
Show Legend
- 1 Center for Health and Human Sciences
- 2 Center for Basic Sciences
- 3 Center for Oral Health Sciences
- 4 Center for Biomedicine (incl. Core Facilities, Charité 3ᴿ, Research Center and Excellence Cluster)
- 5 Center for Diagnostic Laboratory and Preventive Medicine
- 6 Center for Diagnostic and Interventional Radiology and Nuclear Medicine
- 7 Center for Anesthesiology and Intensive Care Medicine
- 8 Center for Surgery
- 9 Center for Orthopedics and Traumatology
- 10 Center for Multidisciplinary Medicine
- 11 Center for Global Health
- 12 Center for Internal Medicine and Dermatology
- 13 Center for Internal Medicine with Gastroenterology and Nephrology
- 14 Center for Tumor Medicine
- 15 Center for Neurology, Neurosurgery and Psychiatry
- 16 Center for Audiology/Phoniatrics, Ophthalmology and Otorhinolaryngology
- 17 Center for Gynecology, Perinatal, Pediatric and Adolescent Medicine
- BIH Berlin Institute of Health
- DHZC Deutsches Herzzentrum der Charité
- Students Students who are not affiliated with one of the organisational units mentioned
- Administration Charité Business Divisions or Administrative Offices
- Other This category refers to participants who are affiliated with spin-offs or holdings of the Charité, BIH´s privileged partner organisation Max Delbrück Center for Molecular Medicine or other (research) organizations.
Participant profile
Status Group
The graph shows the proportion of participants reached by academic status group.
Each segment represents a status category, with its size indicating the percentage share.
Gender of Participants
The graph shows the gender distribution of participants, categorised as female, male, or diverse (non-binary).
Each segment represents the proportion of the target group within that category.
Policy Engagement
Through organisational memberships and participation in advisory boards, committees, and working groups, QUEST Center engages stakeholders across the wider research system. These activities extend the reach of the Center’s expertise by contributing to policy discussions, informing decision-making, and supporting the development of frameworks for responsible research, and translating knowledge generated through the Center’s intervention programme into policy-level and societal change. Please note: Each chart can be downloaded as an image using the camera icon in the chart toolbar; this function is not available for the geomap. To view absolute figures, hover over the relevant chart element.
Engagement landscape
Policy Engagement
The map displays the geographic locations of organisations with which QUEST Center is affiliated, highlighting its regional, national and international networks across multiple regions and sectors.
To view detailed information, move the cursor over the respective markers.
Engagement profile
Type of Organisation
The graph shows the distribution of organisation types in which QUEST members are active, highlighting the Center's breadth of organisational representations.
Each segment corresponds to a specific type of organisation, with its size reflecting the respective percentage share.
Representative Role
The graph shows the distribution of representation roles across the organisational bodies (e.g., working groups, boards, or committees), highlighting the breadth of organisational functions represented by QUEST members.
Each segment corresponds to a specific representation role, with its size reflecting the respective percentage share.
Operational Scope
The graph shows the operational scope of organisational bodies, including working groups, boards and committees, with which QUEST Center is engaged.
Each bar represents a scope category, with its length corresponding to the number of organisations operating at that level.
Grants / Project funding
Activity trends
Grants / Project funding — Aggregate
Intramural funding programmes such as the translational partnership fellowship SPOKES, and the Patient and Stakeholder Engagement (PSE) Grant/Fund promote responsible research and strengthen local research environments.
Each bar represents a funding line, with its length corresponding to the number of projects funded.
Grants / Project funding — Occurrences over Time
Each dot marks a distinct activity occurrence on its recorded date. Repeated participant records for the same activity instance and date count once; larger dots indicate several distinct occurrences on the same date.
Organisational reach
Distribution of Participants (Charité)
The graph shows the distribution of researchers who received QUEST research funding across different organisational units.
Each bar represents a Charité unit, with its height corresponding to the number of principal investigators (Patient & Stakeholder Grant, Patient & Stakeholder Fund) or research fellows (Translational Partnership Fellowship, SPOKES) awarded funding.
Show Legend
- 1 Center for Health and Human Sciences
- 2 Center for Basic Sciences
- 3 Center for Oral Health Sciences
- 4 Center for Biomedicine (incl. Core Facilities, Charité 3ᴿ, Research Center and Excellence Cluster)
- 5 Center for Diagnostic Laboratory and Preventive Medicine
- 6 Center for Diagnostic and Interventional Radiology and Nuclear Medicine
- 7 Center for Anesthesiology and Intensive Care Medicine
- 8 Center for Surgery
- 9 Center for Orthopedics and Traumatology
- 10 Center for Multidisciplinary Medicine
- 11 Center for Global Health
- 12 Center for Internal Medicine and Dermatology
- 13 Center for Internal Medicine with Gastroenterology and Nephrology
- 14 Center for Tumor Medicine
- 15 Center for Neurology, Neurosurgery and Psychiatry
- 16 Center for Audiology/Phoniatrics, Ophthalmology and Otorhinolaryngology
- 17 Center for Gynecology, Perinatal, Pediatric and Adolescent Medicine
- BIH Berlin Institute of Health
- DHZC Deutsches Herzzentrum der Charité
- Students Students who are not affiliated with one of the organisational units mentioned
- Administration Charité Business Divisions or Administrative Offices
- Other This category refers to participants who are affiliated with spin-offs or holdings of the Charité, BIH´s privileged partner organisation Max Delbrück Center for Molecular Medicine or other (research) organizations.
Distribution of Participants (BIH)
The graph shows the distribution of researchers who received QUEST research funding across different organisational units.
Each bar represents a BIH unit, with its height corresponding to the number of principal investigators (Patient & Stakeholder Grant, Patient & Stakeholder Fund) or research fellows (Translational Partnership Fellowship, SPOKES) awarded funding.
Show Legend
- CMA— Central Management and Administration
- TSA — Translational Sciences and Applications (TSA)
- QUEST — Center for Responsible Research (QUEST) - Not Applicable
- CSC — Clinical Study Center
- Core Units — Core Facilities
- EDS — Exploratory Diagnostic Sciences (EDS)
- Vascular Biomedicine — Center of Vascular Biomedicine
- Immunomics — Center of Immunomics
- Genomics — Center of Genomic Medicine
- APT — Advanced and Personalized Therapies (APT)
- Julius Wolff — Musculoskeletal Biomechanics and Regeneration
- BCRT — Center for Regenerative Therapies (BCRT)
- MHDS — Medical Health Data Sciences (MHDS)
- Digital Health — Center Digital Health
- Health Data Sc. — Center Health Data Sciences
- CPD — Competence and Project Development
- BIA — Biomedical Innovation Academy (BIA)
- CBI — Charité BIH Innovation (CBI)
- Clinical Incubator — Clinical Incubator
- Not Specified — BIH members, Section or Center not specified
Participant profile
Status Group
The graph shows the proportion of participants reached by academic status group.
Each segment represents a status category, with its size indicating the percentage share.
Gender of Participants
The graph shows the gender distribution of participants, categorised as female, male, or diverse (non-binary).
Each segment represents the proportion of the target group within that category.
Trainings
Activity trends
Trainings — Aggregate
BIH QUEST Center and partners offer training from introductory workshops to advanced courses. Main themes include systematic reviews, patient and stakeholder engagement, ethics and animal welfare, methodological rigour, research data management, and open science publishing.
Each bar represents a course, with its length corresponding to the number delivered.
Trainings — Occurrences over Time
Each dot marks a distinct activity occurrence on its recorded date. Repeated participant records for the same activity instance and date count once; larger dots indicate several distinct occurrences on the same date.
Training profile
Training Design
As part of the QUEST Center’s Training Transfer Study, the graph illustrates the results of an online survey on the Training Design for educational programme measures conducted by QUEST Center and its partner organisations. (For more information, please see https://quest-compass-training-transfer-dashboard.charite.de/.) The following constructs were examined:
- Training Methods – Refers to the appropriateness and effectiveness of the training methods used.
- Training Situation – Refers to how well the training fits the respective training participants.
- Training Orientation – Refers to the alignment of the training with the needs and requirements of the training participants.
- Training Level of Difficulty – Refers to the alignment of the training curriculum with the prior knowledge of the training participants.
- Training Support – Refers to the guidance, feedback, and support provided by the trainers during the training.
Items representing these constructs were presented to training participants and rated on a seven-point Likert scale (1 = strongly disagree, 7 = strongly agree) in response to the prompt: “To what extent do you agree with the following statements?” Median values (blue line) and interquartile ranges (light blue shading) are displayed, with scale point 7 representing the highest possible rating.
Organisational reach
Distribution of Participants (Global)
The map displays the global distribution of training participants and highlights the interest of the target group in education and training opportunities provided by BIH QUEST Center and its partner organisations.
Distribution of Participants (Charité)
The graph shows the distribution of QUEST training participants across different organisational units.
Each bar represents a Charité unit, with its height corresponding to the number of participations in training activities, illustrating the target group’s interest in training measures offered by BIH QUEST Center and its partner organisations.
Show Legend
- 1 Center for Health and Human Sciences
- 2 Center for Basic Sciences
- 3 Center for Oral Health Sciences
- 4 Center for Biomedicine (incl. Core Facilities, Charité 3ᴿ, Research Center and Excellence Cluster)
- 5 Center for Diagnostic Laboratory and Preventive Medicine
- 6 Center for Diagnostic and Interventional Radiology and Nuclear Medicine
- 7 Center for Anesthesiology and Intensive Care Medicine
- 8 Center for Surgery
- 9 Center for Orthopedics and Traumatology
- 10 Center for Multidisciplinary Medicine
- 11 Center for Global Health
- 12 Center for Internal Medicine and Dermatology
- 13 Center for Internal Medicine with Gastroenterology and Nephrology
- 14 Center for Tumor Medicine
- 15 Center for Neurology, Neurosurgery and Psychiatry
- 16 Center for Audiology/Phoniatrics, Ophthalmology and Otorhinolaryngology
- 17 Center for Gynecology, Perinatal, Pediatric and Adolescent Medicine
- BIH Berlin Institute of Health
- DHZC Deutsches Herzzentrum der Charité
- Students Students who are not affiliated with one of the organisational units mentioned
- Administration Charité Business Divisions or Administrative Offices
- Other This category refers to participants who are affiliated with spin-offs or holdings of the Charité, BIH´s privileged partner organisation Max Delbrück Center for Molecular Medicine or other (research) organizations.
Distribution of Participants (BIH)
The graph shows the distribution of QUEST training participants across different organisational units.
Each bar represents a BIH unit, with its height corresponding to the number of participations in training activities, illustrating the target group’s interest in training measures offered by BIH QUEST Center and its partner organisations.
Show Legend
- CMA— Central Management and Administration
- TSA — Translational Sciences and Applications (TSA)
- QUEST — Center for Responsible Research (QUEST) - Not Applicable
- CSC — Clinical Study Center
- Core Units — Core Facilities
- EDS — Exploratory Diagnostic Sciences (EDS)
- Vascular Biomedicine — Center of Vascular Biomedicine
- Immunomics — Center of Immunomics
- Genomics — Center of Genomic Medicine
- APT — Advanced and Personalized Therapies (APT)
- Julius Wolff — Musculoskeletal Biomechanics and Regeneration
- BCRT — Center for Regenerative Therapies (BCRT)
- MHDS — Medical Health Data Sciences (MHDS)
- Digital Health — Center Digital Health
- Health Data Sc. — Center Health Data Sciences
- CPD — Competence and Project Development
- BIA — Biomedical Innovation Academy (BIA)
- CBI — Charité BIH Innovation (CBI)
- Clinical Incubator — Clinical Incubator
- Not Specified — BIH members, Section or Center not specified
Participant profile
Status Group
The graph shows the proportion of participants reached by academic status group.
Each segment represents a status category, with its size indicating the percentage share.
Gender of Participants
The graph shows the gender distribution of participants, categorised as female, male, or diverse (non-binary).
Each segment represents the proportion of the target group within that category.
Consultings
Activity trends
Consultings — Aggregate
In addition to training, BIH QUEST Center provides consultations for researchers, research teams, and organisational bodies to strengthen responsible research practices and build capacity.
Each bar represents a subject area, with its length corresponding to the number of consultations provided.
Consultings — Occurrences over Time
Each dot marks a distinct activity occurrence on its recorded date. Repeated participant records for the same activity instance and date count once; larger dots indicate several distinct occurrences on the same date.
Consultation profile
Consulting Activities (project-related)
In addition to training, BIH QUEST Center provides consultations for researchers, research teams, and organisational bodies to strengthen responsible research practices and build capacity.
Each bar represents a scientific consortium, with its length corresponding to the number of projects consulted over a time period of 3 years.
Consultation Type
The graph shows the consultancies provided across various consultation levels.
Each bar represents the frequency of consultation types, ranging from introductory sessions and onboarding support to more advanced services, reflecting the depth of services offered.
Show Legend
- Introductory consultation: Focuses on establishing understanding. Provides a clear overview of the topic, offering essential background knowledge to build a solid foundational understanding. Typical Time Frame: 1–2 hours (single session).
- Onboarding support: Focuses on initial client integration. Assists new clients during the introduction phase to ensure a seamless transition into processes or services. Includes post-support sessions and sustainability checks for long-term effectiveness. Typical Time Frame: 1–4 weeks (initial onboarding with follow-up check-ins).
- Informational consulting: Focuses on expert insights. Delivers detailed information, facts, resources, materials, and legal/technical guidance while addressing specific questions. May involve reviewing documents (e.g., concept drafts, grant applications, manuscripts) and providing detailed recommendations for improvement. Typical Time Frame: 1–5 days (depending on scope and complexity).
- Decision-oriented consulting: Focuses on strategic decision-making. Enables informed choices by evaluating and comparing options, analyzing potential implications (legal, operational, financial) and delivering structured, actionable recommendations. Typical Time Frame: 1–3 weeks (including analysis and recommendation phases).
- Supervisory consulting: Focuses on joint solution-building. Works with clients to co-create tailored solutions, offering ongoing guidance, coaching, and oversight. Supports implementation of action plans or key processes. Typical Time Frame: 1–6 months (depending on complexity and implementation stages).
- Transformational guidance: Focuses on long-term change and innovation. Partners with clients on strategic, high-impact initiatives. Drives innovation, sustainability, and organizational transformation through collaborative, forward-thinking strategies. Typical Time Frame: 6–18 months (multi-phase, milestone-driven).
Business Sector
The graph shows the stakeholders reached across different fields of work or business sectors.
Each segment represents the proportion of stakeholders reached, with its size indicating the corresponding percentage.
Consultation Object
Organisation Level
Organisational reach
Distribution of Participants (Global)
The map displays the global distribution of consultation clients, illustrating the demand for the consulting services offered by BIH QUEST Center.
Distribution of Participants (Charité)
The graph shows the distribution of QUEST consultation participants across different organisational units.
Each bar represents a Charité unit, with its height corresponding to the number of consultations, illustrating the interest of the target group in advisory services provided by BIH QUEST Center.
Show Legend
- 1 Center for Health and Human Sciences
- 2 Center for Basic Sciences
- 3 Center for Oral Health Sciences
- 4 Center for Biomedicine (incl. Core Facilities, Charité 3ᴿ, Research Center and Excellence Cluster)
- 5 Center for Diagnostic Laboratory and Preventive Medicine
- 6 Center for Diagnostic and Interventional Radiology and Nuclear Medicine
- 7 Center for Anesthesiology and Intensive Care Medicine
- 8 Center for Surgery
- 9 Center for Orthopedics and Traumatology
- 10 Center for Multidisciplinary Medicine
- 11 Center for Global Health
- 12 Center for Internal Medicine and Dermatology
- 13 Center for Internal Medicine with Gastroenterology and Nephrology
- 14 Center for Tumor Medicine
- 15 Center for Neurology, Neurosurgery and Psychiatry
- 16 Center for Audiology/Phoniatrics, Ophthalmology and Otorhinolaryngology
- 17 Center for Gynecology, Perinatal, Pediatric and Adolescent Medicine
- BIH Berlin Institute of Health
- DHZC Deutsches Herzzentrum der Charité
- Students Students who are not affiliated with one of the organisational units mentioned
- Administration Charité Business Divisions or Administrative Offices
- Other This category refers to participants who are affiliated with spin-offs or holdings of the Charité, BIH´s privileged partner organisation Max Delbrück Center for Molecular Medicine or other (research) organizations.
Distribution of Participants (BIH)
The graph shows the distribution of QUEST consultation participants across different organisational units.
Each bar represents a BIH unit, with its height corresponding to the number of consultations, illustrating the interest of the target group in advisory services provided by BIH QUEST Center.
Show Legend
- CMA— Central Management and Administration
- TSA — Translational Sciences and Applications (TSA)
- QUEST — Center for Responsible Research (QUEST) - Not Applicable
- CSC — Clinical Study Center
- Core Units — Core Facilities
- EDS — Exploratory Diagnostic Sciences (EDS)
- Vascular Biomedicine — Center of Vascular Biomedicine
- Immunomics — Center of Immunomics
- Genomics — Center of Genomic Medicine
- APT — Advanced and Personalized Therapies (APT)
- Julius Wolff — Musculoskeletal Biomechanics and Regeneration
- BCRT — Center for Regenerative Therapies (BCRT)
- MHDS — Medical Health Data Sciences (MHDS)
- Digital Health — Center Digital Health
- Health Data Sc. — Center Health Data Sciences
- CPD — Competence and Project Development
- BIA — Biomedical Innovation Academy (BIA)
- CBI — Charité BIH Innovation (CBI)
- Clinical Incubator — Clinical Incubator
- Not Specified — BIH members, Section or Center not specified
Participant profile
Status Group
The graph shows the target group reached by status/management level.
Each segment represents the proportion of one of several status levels.
Gender of Participants
The graph shows the gender distribution of participants, categorised as female, male, or diverse (non-binary).
Each segment represents the proportion of the target group within that category.
Digital Applications / Tools
Activity trends
Digital Applications / Tools — Aggregate
BIH QUEST Center supports the use of digital tools, including the electronic laboratory notebook (ELN), the quality management system PREMIER, and its error management module LabCIRS.
Each bar represents a tool, with its length corresponding to the number of teams or consortia implementing it.
Digital Applications / Tools — Occurrences over Time
Each dot marks a distinct activity occurrence on its recorded date. Repeated participant records for the same activity instance and date count once; larger dots indicate several distinct occurrences on the same date.
Organisational reach
Distribution of Participants (Global)
The map displays the global distribution of research teams using QUEST tools, demonstrating the target group’s interest in digital resources for strengthening research quality provided by BIH QUEST Center.
Distribution of Participants (Charité)
The graph shows the distribution of research teams using ELN Labfolder, as well as teams or consortia using the quality management tool PREMIER (including LabCIRS), across different organisational units.
Each bar represents a Charité unit, with its height corresponding to the number of teams adopting QUEST tools, illustrating the interest of research teams in digital resources provided by BIH QUEST Center.
Show Legend
- 1 Center for Health and Human Sciences
- 2 Center for Basic Sciences
- 3 Center for Oral Health Sciences
- 4 Center for Biomedicine (incl. Core Facilities, Charité 3ᴿ, Research Center and Excellence Cluster)
- 5 Center for Diagnostic Laboratory and Preventive Medicine
- 6 Center for Diagnostic and Interventional Radiology and Nuclear Medicine
- 7 Center for Anesthesiology and Intensive Care Medicine
- 8 Center for Surgery
- 9 Center for Orthopedics and Traumatology
- 10 Center for Multidisciplinary Medicine
- 11 Center for Global Health
- 12 Center for Internal Medicine and Dermatology
- 13 Center for Internal Medicine with Gastroenterology and Nephrology
- 14 Center for Tumor Medicine
- 15 Center for Neurology, Neurosurgery and Psychiatry
- 16 Center for Audiology/Phoniatrics, Ophthalmology and Otorhinolaryngology
- 17 Center for Gynecology, Perinatal, Pediatric and Adolescent Medicine
- BIH Berlin Institute of Health
- DHZC Deutsches Herzzentrum der Charité
- Students Students who are not affiliated with one of the organisational units mentioned
- Administration Charité Business Divisions or Administrative Offices
- Other This category refers to participants who are affiliated with spin-offs or holdings of the Charité, BIH´s privileged partner organisation Max Delbrück Center for Molecular Medicine or other (research) organizations.
Distribution of Participants (BIH)
The graph shows the distribution of research teams using ELN Labfolder, as well as teams or consortia using the quality management tool PREMIER (including LabCIRS), across different organisational units.
Each bar represents a BIH unit, with its height corresponding to the number of teams adopting QUEST tools, illustrating the interest of research teams in digital resources provided by BIH QUEST Center.
Show Legend
- CMA— Central Management and Administration
- TSA — Translational Sciences and Applications (TSA)
- QUEST — Center for Responsible Research (QUEST) - Not Applicable
- CSC — Clinical Study Center
- Core Units — Core Facilities
- EDS — Exploratory Diagnostic Sciences (EDS)
- Vascular Biomedicine — Center of Vascular Biomedicine
- Immunomics — Center of Immunomics
- Genomics — Center of Genomic Medicine
- APT — Advanced and Personalized Therapies (APT)
- Julius Wolff — Musculoskeletal Biomechanics and Regeneration
- BCRT — Center for Regenerative Therapies (BCRT)
- MHDS — Medical Health Data Sciences (MHDS)
- Digital Health — Center Digital Health
- Health Data Sc. — Center Health Data Sciences
- CPD — Competence and Project Development
- BIA — Biomedical Innovation Academy (BIA)
- CBI — Charité BIH Innovation (CBI)
- Clinical Incubator — Clinical Incubator
- Not Specified — BIH members, Section or Center not specified
Participant profile
Status Group
The graph shows the proportion of participants reached by academic status group.
Each segment represents a status category, with its size indicating the percentage share.
Gender of Participants
The graph shows the gender distribution of participants, categorised as female, male, or diverse (non-binary).
Each segment represents the proportion of the target group within that category.
Transfer Condition
The results shown derive from the Center’s Training Transfer study and highlight key influencing factors of transferring training contents into everyday working practice. For more information, please see the Training Transfer dashboard. Note: To view absolute figures, please move the cursor over the respective chart. Each chart can be downloaded as an image via the camera icon in the chart's toolbar (not available for the geomap).
Transfer conditions
Learning & Retention
The stage Learning and Retention focuses on how training participants retain their newly acquired knowledge and apply it in their workplaces. The following constructs were examined:
- Utility – Refers to the practical relevance and applicability of the training content.
- Content Validity – Refers to how well the newly acquired knowledge and skills align with the work requirements.
- Learning – Refers to the ability of training participants to retain and recall the knowledge acquired in the training.
- Learners’ Readiness – Refers to how well learners were prepared prior to engaging in the learning activity.
- Satisfaction – Refers to the overall contentment of the training participants with their training experience.
- Self-efficacy – Refers to the confidence of training participants in their ability to apply the newly acquired knowledge and skills in the workplace.
Items presented to training participants were rated on a seven-point Likert scale (1 = strongly disagree, 7 = strongly agree) in response to the prompt: “To what extent do you agree with the following statements?” Median values (blue line) and interquartile ranges (light blue shading) are displayed, with scale point 7 representing the highest possible rating.
Work Environment
The stage Work Environment focuses on how contextual factors facilitate or hinder the transfer of training into practice. The following constructs were examined:
- Transfer Motivation – Refers to the willingness of training participants to apply the newly acquired knowledge in the workplace.
- Transfer Capacity – Refers to how work requirements enable or hinder the effective application of training content in the workplace.
- Transfer Support – Refers to the guidance of the transfer process by supervisors/superiors of training participants.
- Transfer Climate – Refers to how colleagues encourage and assist the transfer process.
Items presented to training participants were rated on a seven-point Likert scale (1 = strongly disagree, 7 = strongly agree) in response to the prompt: “To what extent do you agree with the following statements?” Median values (blue line) and interquartile ranges (light blue shading) are displayed, with scale point 7 representing the highest possible rating.
Awards
Activity trends
QUEST Awards — Aggregate
BIH QUEST Center offers QUEST Awards to incentivise data sharing, preregistration, transparent reporting, and patient engagement. These awards promote research assessment reform and foster higher-quality research outputs.
Each bar represents an award type, with its length corresponding to the number granted.
QUEST Awards — Occurrences over Time
Each dot marks a distinct activity occurrence on its recorded date. Repeated participant records for the same activity instance and date count once; larger dots indicate several distinct occurrences on the same date.
Organisational reach & Participant profile
Distribution of Participants (Charité)
The graph shows the distribution of researchers who received a QUEST Award across different organisational units.
Each bar represents a Charité unit, with its height corresponding to the number of awardees.
Show Legend
- 1 Center for Health and Human Sciences
- 2 Center for Basic Sciences
- 3 Center for Oral Health Sciences
- 4 Center for Biomedicine (incl. Core Facilities, Charité 3ᴿ, Research Center and Excellence Cluster)
- 5 Center for Diagnostic Laboratory and Preventive Medicine
- 6 Center for Diagnostic and Interventional Radiology and Nuclear Medicine
- 7 Center for Anesthesiology and Intensive Care Medicine
- 8 Center for Surgery
- 9 Center for Orthopedics and Traumatology
- 10 Center for Multidisciplinary Medicine
- 11 Center for Global Health
- 12 Center for Internal Medicine and Dermatology
- 13 Center for Internal Medicine with Gastroenterology and Nephrology
- 14 Center for Tumor Medicine
- 15 Center for Neurology, Neurosurgery and Psychiatry
- 16 Center for Audiology/Phoniatrics, Ophthalmology and Otorhinolaryngology
- 17 Center for Gynecology, Perinatal, Pediatric and Adolescent Medicine
- BIH Berlin Institute of Health
- DHZC Deutsches Herzzentrum der Charité
- Students Students who are not affiliated with one of the organisational units mentioned
- Administration Charité Business Divisions or Administrative Offices
- Other This category refers to participants who are affiliated with spin-offs or holdings of the Charité, BIH´s privileged partner organisation Max Delbrück Center for Molecular Medicine or other (research) organizations.
Distribution of Participants (BIH)
The graph shows the distribution of researchers who received a QUEST Award across different organisational units.
Each bar represents a BIH unit, with its height corresponding to the number of awardees.
Show Legend
- CMA— Central Management and Administration
- TSA — Translational Sciences and Applications (TSA)
- QUEST — Center for Responsible Research (QUEST) - Not Applicable
- CSC — Clinical Study Center
- Core Units — Core Facilities
- EDS — Exploratory Diagnostic Sciences (EDS)
- Vascular Biomedicine — Center of Vascular Biomedicine
- Immunomics — Center of Immunomics
- Genomics — Center of Genomic Medicine
- APT — Advanced and Personalized Therapies (APT)
- Julius Wolff — Musculoskeletal Biomechanics and Regeneration
- BCRT — Center for Regenerative Therapies (BCRT)
- MHDS — Medical Health Data Sciences (MHDS)
- Digital Health — Center Digital Health
- Health Data Sc. — Center Health Data Sciences
- CPD — Competence and Project Development
- BIA — Biomedical Innovation Academy (BIA)
- CBI — Charité BIH Innovation (CBI)
- Clinical Incubator — Clinical Incubator
- Not Specified — BIH members, Section or Center not specified
Status Group
The graph shows the proportion of participants reached by academic status group.
Each segment represents a status category, with its size indicating the percentage share.
Gender of Participants
The graph shows the gender distribution of participants, categorised as female, male, or diverse (non-binary).
Each segment represents the proportion of the target group within that category.
Open Data LOM/IOM
Activity trends
Open Data Funding Cycles — Aggregate
The aggregate graph shows distinct Open Data funding cycles by instrument. Records sharing the same instrument and start date count as one occurrence.
Open Data Funding Cycles — Occurrences over Time
Each dot marks a distinct activity occurrence on its recorded date. Repeated participant records for the same activity instance and date count once; larger dots indicate several distinct occurrences on the same date.
Organisational reach
Distribution of Participants (Charité)
The graph shows the distribution of allocated Open Data LOM (Leistungsorientierte Mittelvergabe/Performance-oriented Funds) across different organisational units.
Each bar represents a Charité unit, with its height corresponding to the share of authorship positions.
Show Legend
- 1 Center for Health and Human Sciences
- 2 Center for Basic Sciences
- 3 Center for Oral Health Sciences
- 4 Center for Biomedicine (incl. Core Facilities, Charité 3ᴿ, Research Center and Excellence Cluster)
- 5 Center for Diagnostic Laboratory and Preventive Medicine
- 6 Center for Diagnostic and Interventional Radiology and Nuclear Medicine
- 7 Center for Anesthesiology and Intensive Care Medicine
- 8 Center for Surgery
- 9 Center for Orthopedics and Traumatology
- 10 Center for Multidisciplinary Medicine
- 11 Center for Global Health
- 12 Center for Internal Medicine and Dermatology
- 13 Center for Internal Medicine with Gastroenterology and Nephrology
- 14 Center for Tumor Medicine
- 15 Center for Neurology, Neurosurgery and Psychiatry
- 16 Center for Audiology/Phoniatrics, Ophthalmology and Otorhinolaryngology
- 17 Center for Gynecology, Perinatal, Pediatric and Adolescent Medicine
- BIH Berlin Institute of Health
- DHZC Deutsches Herzzentrum der Charité
- Students Students who are not affiliated with one of the organisational units mentioned
- Administration Charité Business Divisions or Administrative Offices
- Other This category refers to participants who are affiliated with spin-offs or holdings of the Charité, BIH´s privileged partner organisation Max Delbrück Center for Molecular Medicine or other (research) organizations.
Distribution of Participants (BIH)
The graph shows the distribution of allocated Open Data IOM (Indikatorenorientierte Mittelvergabe/Performance-oriented Funds) across different organisational units.
Each bar represents a BIH unit, with its height corresponding to the share of authorship positions.
Show Legend
- CMA— Central Management and Administration
- TSA — Translational Sciences and Applications (TSA)
- QUEST — Center for Responsible Research (QUEST) - Not Applicable
- CSC — Clinical Study Center
- Core Units — Core Facilities
- EDS — Exploratory Diagnostic Sciences (EDS)
- Vascular Biomedicine — Center of Vascular Biomedicine
- Immunomics — Center of Immunomics
- Genomics — Center of Genomic Medicine
- APT — Advanced and Personalized Therapies (APT)
- Julius Wolff — Musculoskeletal Biomechanics and Regeneration
- BCRT — Center for Regenerative Therapies (BCRT)
- MHDS — Medical Health Data Sciences (MHDS)
- Digital Health — Center Digital Health
- Health Data Sc. — Center Health Data Sciences
- CPD — Competence and Project Development
- BIA — Biomedical Innovation Academy (BIA)
- CBI — Charité BIH Innovation (CBI)
- Clinical Incubator — Clinical Incubator
- Not Specified — BIH members, Section or Center not specified